
High-level review of the 2024, 2025 and 2026 Franchise Disclosure Documents
Swig At a Glance
Brand: Swig
Industry: Specialty beverages, dirty soda and sweets
Franchisor: Swig Franchising, LLC
Franchising Since: September 2022
FDDs Reviewed: April 19, 2024; May 7, 2025, as amended October 16, 2025; April 30, 2026
Relevant FDD Topics: Items 3–8, 12, 19, 20 and 21; audited financial statements
Estimated Initial Investment: $559,300 to $1,981,000 for one store
Initial Franchise Fee: $39,500
Overall Risk Signal: 🟠 Orange
Primary Concern: Strong sales in a limited franchise sample do not establish owner profitability. The latest earnings measure excludes substantial expenses, while investment requirements and unresolved disclosure inconsistencies warrant closer examination.
This independent review is educational commentary, not a recommendation to buy or reject Swig or a substitute for professional legal, financial, tax or investment guidance. Findings reflect the supplied documents and may change with new information. Buyers should obtain current disclosures, validate results with operators and consult their own advisors.
The signals below express our assessment of disclosed issues. They do not forecast the outcome of a particular store or investment.
Why This Report Matters
I rarely see my local Swig empty. There is usually a line around the building.
That is the kind of observation that makes a franchise appealing. Customers are showing up, the product is easy to understand, and the business operates from a relatively small building. For someone considering ownership, the next question is what that activity produces after the bills are paid.
A line is a local observation, not a financial statement. Swig’s disclosures nevertheless provide evidence of substantial sales at some franchise stores. The 2026 FDD reports annual gross sales ranging from approximately $849,000 to $2.19 million among 16 franchise stores that operated throughout 2025.
The three-year review also reveals an important change: the latest Item 19 replaces the earlier EBITDA presentation with a margin that subtracts only product and labor costs. At the same time, the upper end of the estimated opening investment approaches $2 million.
The issue for buyers is whether the sales their particular location can sustain will support its full operating costs, capital commitment and financing.
🟡 Actual Franchise Sales Provide Useful Evidence, but the Sample Is Limited
The 2026 Item 19 reports these results for 16 traditional franchise stores operating for all of 2025:
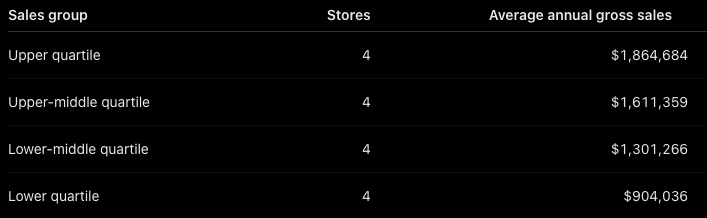
The four equally sized groups imply an overall average of approximately $1.42 million. This is our calculation from the disclosed averages, not a separately reported FDD figure. Individual results range from $849,407 to $2,189,681.
Those sales are meaningful evidence of demand. They also show considerable variation: the highest reported store generated approximately 2.6 times the lowest store’s sales.
The sample covers only 16 of the stated 42 traditional franchise stores at year-end. Most franchise locations therefore do not appear in the full-year results. The table does not show their opening losses, ramp-up periods or working-capital needs. Nor should 16 stores be assumed to represent 16 independent owners.
The prior FDD combines company and franchise stores in its sales presentation. Comparing its average directly with the newest franchise-only average would not establish same-store growth.
Source: 2025 Item 19, pp. 55–57; 2026 Item 19, pp. 57–59.
Signal: 🟡 Yellow
🟠 The New Margin Measure Does Not Show What Owners Keep
The financial-performance presentation changes materially across the three FDDs.
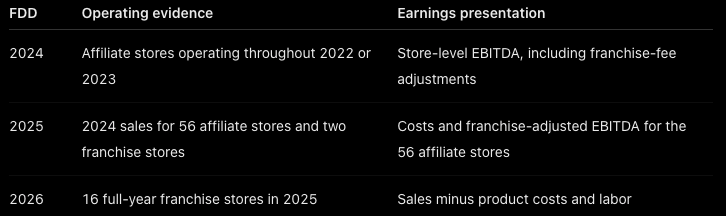
The 2025 FDD reports average franchise-adjusted EBITDA of $193,746, or 15.9%, and median adjusted EBITDA of $161,018, or 13.9%. These are affiliate-store results adjusted for franchise royalties and marketing contributions, not actual franchise-owner earnings.
In 2026, the reported average “Store-Level Operating Margin” ranges from 37.1% to 46.2% across the four groups. The definition subtracts cost of goods sold and labor. It excludes occupancy, local marketing, owner compensation, financing costs, depreciation and amortization. The calculation also leaves royalties and marketing-fund contributions to be paid.
The larger percentages cannot be interpreted as an improvement from 15.9% EBITDA to roughly 40% owner profit. They measure different stages of the expense calculation using different store populations.
Actual franchise data improves the relevance of the sample. Buyers still need complete store financial statements to determine what remains after all expenses.
Source: Items 19 in all three FDDs; particularly 2025 pp. 55–57 and 2026 pp. 57–59.
Signal: 🟠 Orange
🟠 A Compact Store Can Require a Substantial Capital Commitment
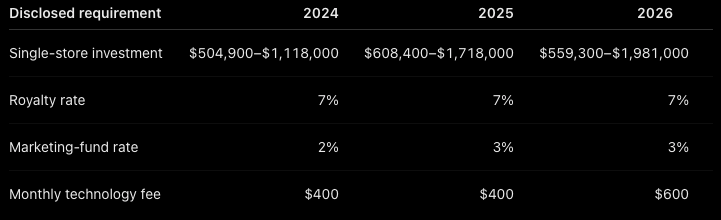
The investment ceiling increased approximately 77% between the 2024 and 2026 disclosures. That does not establish a 77% cost increase for an identical store: site conditions and construction formats vary.
The 2026 FDD estimates $900,000 to $1,415,000 for ground-up site improvements and construction alone, excluding land. An existing end-cap with a drive-thru carries a lower improvement estimate of $280,000 to $525,000. Neither figure is a complete opening budget.
At an illustrative $1 million in annual sales, the current royalty and marketing-fund rates total $100,000, plus $7,200 annually for technology. That is before product costs, payroll, rent and other expenses. This illustration is neither a sales forecast nor a complete operating model.
The initial investment includes $35,000 to $80,000 in additional funds for the first three months. Buyers should establish whether that allowance matches actual opening experiences and their financing obligations.
Source: Items 6–7 in all three FDDs; 2026 pp. 12–20.
Signal: 🟠 Orange
🟠 Development Rights Do Not Pay for the Remaining Stores
The 2026 FDD describes a minimum five-unit area development agreement. Its $717,300 to $2,139,000 estimate includes $197,500 in development fees plus the estimated investment to open the first store, excluding that store’s already-counted franchise fee.
It does not cover the construction, equipment and operating capital required for all five locations.
The development schedule also matters. Missing deadlines can result in termination or reduction of development rights and forfeiture of payments attributable to undeveloped units. An operator may therefore face expansion commitments before learning how the first store performs through a complete operating cycle.
Buyers should obtain a store-by-store capital plan, a realistic development schedule and a clear explanation of what happens if permitting, financing or site availability delays an opening.
Source: 2026 Items 5, 7 and 12, pp. 11, 20–21 and 41.
Signal: 🟠 Orange
🟠 Growth and Outlet Counts Need a Written Reconciliation
The 2026 Item 20 franchise table reports 19 outlets at the beginning of 2025, 27 openings, three Texas locations reacquired by the franchisor and 43 outlets at year-end.
The disclosure also identifies a former franchisee that voluntarily terminated its development and franchise agreements. Neither a reacquisition nor a voluntary termination establishes the reason for an owner’s departure. The document does not establish whether these events were connected.
Several counts do not reconcile:
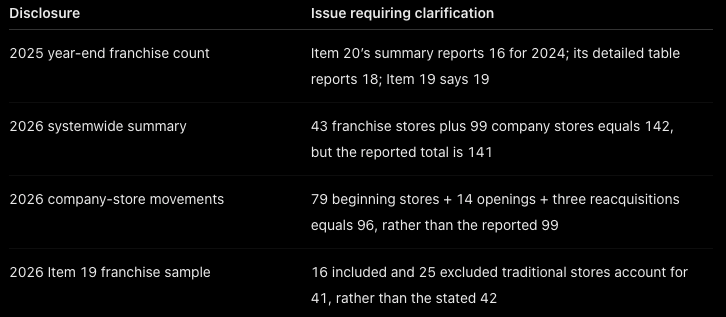
These discrepancies warrant corrected schedules before relying on precise systemwide growth figures. They do not, by themselves, establish that the underlying businesses are unsuccessful or that management intentionally misstated the counts.
Buyers should request a dated location register showing ownership, opening dates, acquisitions, closures and the stores included in Item 19. They should also speak with former operators and owners whose stores were reacquired.
Source: 2025 Items 19–20, pp. 55 and 58–59; 2026 Items 19–20, pp. 57 and 60–63.
Signal: 🟠 Orange
🟡 Franchisor Finances Improved After Prior Years Were Restated
Swig’s 2026 audited statements restate 2023 and 2024. Note 7 attributes the changes to retroactive modifications of area development agreements and a reassessment of franchise revenue recognition.
For 2024, recognized franchise-fee revenue was revised from $1,179,007 to $29,624, while reported equity moved from negative $165,189 to negative $1,561,425. These changes concern accounting recognition and contract treatment; they should not be described as equivalent amounts of cash disappearing.
The auditor highlights the restatement but does not modify the audit opinion because of it.
The subsequent financial position improved. For 2025, Swig Franchising, LLC reports approximately $2.45 million in net income, $4.29 million in cash and $695,112 in positive equity. Royalty revenue increased to approximately $2.36 million.
These are positive developments for the franchisor. They are not evidence of franchisee profitability. Buyers should understand the agreement modifications, the accounting corrections and whether current resources support the planned expansion.
Source: 2026 Exhibit B, printed pp. 70–80, especially Note 7.
Signal: 🟡 Yellow
🟡 Purchasing Rules and Territory Terms Affect Flexibility
Swig estimates that required purchases account for 85% to 95% of opening and operating purchases. It currently shares 75% of cash rebates attributable to franchisees’ required purchases, but expressly states that it has no obligation to share them. Buyers should distinguish a current practice from a guaranteed contractual benefit.
The franchise territory generally has a one-to-three-mile radius, but may be zero miles in densely populated areas. Swig restricts additional traditional Swig stores within the granted territory while retaining rights involving nontraditional outlets and other sales channels.
Those terms make the particular site, territory map and future development plans important. A busy store today does not establish how demand will be distributed after nearby expansion.
Items 3 and 4 state that no litigation or bankruptcy is required to be disclosed. That is useful context, although it is not a guarantee about future disputes or operating results.
Source: 2026 Items 3–4, 8 and 12, pp. 10, 24 and 39–41.
Signal: 🟡 Yellow
The Reality Check
Swig has credible evidence of customer demand and substantial sales at some franchise stores. Its latest disclosure includes actual full-year franchise results, and the franchisor’s financial results improved in 2025.
The evidence still leaves an important gap between sales and owner returns. Only 16 franchise stores appear in the full-year sample, the newest margin measure omits significant expenses, and the opening investment can approach $2 million. Outlet-count inconsistencies and prior financial restatements add questions that deserve clear answers.
The line around the building explains why someone might want to own a Swig. The complete store financials, site economics and development obligations are what buyers need to evaluate the investment.
Overall Risk Signal: 🟠 Orange
The orange assessment reflects elevated diligence needs arising from incomplete franchise profitability evidence, substantial capital exposure, development commitments and unresolved disclosure inconsistencies. It is not a prediction that Swig will fail or a recommendation against the brand.
Corrected outlet schedules, a larger body of complete franchise financial statements and evidence of returns across different store formats and markets could materially change the assessment.
Questions Prospective Swig Buyers Should Ask
What do full franchise-store financial statements show after royalties, marketing, occupancy, owner compensation and financing costs?
Why did Item 19 change its earnings measure, and can buyers obtain a reconciliation to store-level EBITDA?
Which stores and owners make up the 16-store sample? What were their opening costs, ages and markets?
How did newer stores perform during ramp-up, and how much additional cash did owners contribute?
Can the franchisor reconcile the outlet totals across Items 19 and 20 and provide corrected schedules?
Why were three Texas stores reacquired, and what were the circumstances of the disclosed former franchisee’s departure?
What changed in the area development agreements, and how did those modifications affect the restated financial statements?
What is the complete capital requirement for the proposed development commitment, beyond the first location?
What happens if development is delayed, and which fees or rights would be lost?
What nearby development and alternative sales channels are permitted, and how secure are current rebate-sharing practices?
Want the Full Reality Check?
This brief highlights selected findings from three years of Swig disclosures. A full review examines the relationships among store performance, opening costs, system growth, franchisor finances and owner obligations in greater depth.
View Franchise Brand Reports and agreement-review options.
Source documents: Swig Franchising, LLC FDD dated April 19, 2024; FDD dated May 7, 2025, as amended October 16, 2025; FDD dated April 30, 2026. Page references use printed document numbers, which can differ from PDF viewer page numbers. The local traffic observation is the author’s experience, not a systemwide traffic study. Review prepared October 28, 2026.
